
OTTAWA, April 15, 2020 /CNW/ – Statistics released today by the Canadian Real Estate Association (CREA) show national home sales and listings were down sharply between February and March 2020.
Highlights:
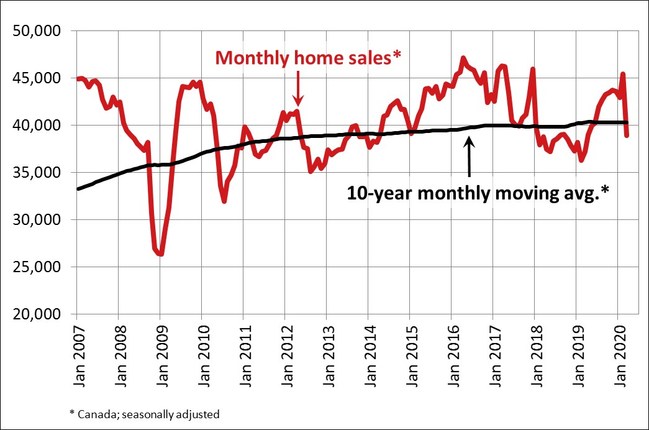
- National home sales fell 14.3% on a month-over-month (m-o-m) basis in March.
- Actual (not seasonally adjusted) activity was up 7.8% year-over-year (y-o-y).
- The number of newly listed properties dropped 12.5% m-o-m.
- The MLS® Home Price Index (HPI) advanced by 0.8% m-o-m and 6.9% y-o-y.
- The actual (not seasonally adjusted) national average sale price climbed 12.5% y-o-y.
Home sales recorded over Canadian MLS® Systems dropped by 14.3% in March 2020 compared to February, as the economic turmoil and physical distancing rules surrounding the COVID-19 pandemic caused both buyers and sellers to increasingly retreat to the sidelines over the second half of the month.

Transactions were down on a m-o-m basis in the vast majority of local markets in March. Among Canada’s largest markets, sales declined in the Greater Toronto Area (GTA) (20.8%), Montreal (-13.3%), Greater Vancouver (-2.9%), The Fraser Valley (-13.6%), Calgary (-26.3%), Edmonton (-13.2%), Winnipeg (-7.3%), Hamilton-Burlington (-24.9%) and Ottawa (-7.9%).
Actual (not seasonally adjusted) sales activity was still running 7.8% above a quiet March in 2019, although that was a considerable slowdown compared to the y-o-y gain of close to 30% recorded in February.
“March 2020 will be remembered around the planet for a long time. Canadian home sales and listings were increasing heading into what was expected to be a busy spring for Canadian REALTORS®,” said Jason Stephen, president of CREA. “After Friday the 13th, everything went sideways. REALTORS® are complying with government directives and advice, all the while adopting virtual technologies allowing them to continue showing properties to clients already in the market, and completing all necessary documents. They remain your best source for information and guidance when negotiating the sale or purchase of a home in these unprecedented times,” continued Stephen.
“Numbers for March 2020 are a reflection of two very different realities, with most of the stronger sales and price growth recorded during the pre-COVID-19 reality which we are no longer in,” said Shaun Cathcart, CREA’s Senior Economist. “The numbers that matter most for understanding what follows are those from mid-March on, and things didn’t really start to ratchet down until week four. Preliminary data from the first week of April suggest both sales and new listings were only about half of what would be normal for that time of year.”
The number of newly listed homes declined by 12.5% in March compared to February. As with sales activity, declines were recorded pretty much across the country.
With sales and new listings each falling by similar magnitudes in March, the national sales-to-new listings ratio edged back to 64% compared to 65.4% in February. While this is down slightly, the bigger picture is that this measure of market balance was remarkably little changed considering the extent to which current economic and social conditions are impacting both buyers and sellers.
Considering the degree and duration to which market balance readings are above or below their long-term averages is the best way of gauging whether local housing market conditions favour buyers or sellers. Market balance measures that are within one standard deviation of their long-term average are generally consistent with balanced market conditions.
Based on a comparison of the sales-to-new listings ratio with the long-term average, two-thirds of all local markets were in balanced market territory in March 2020. Virtually all of the remainder continued to favour sellers.
The number of months of inventory is another important measure of the balance between sales and the supply of listings. It represents how long it would take to liquidate current inventories at the current rate of sales activity.
There were 4.3 months of inventory on a national basis at the end of March 2020. While this is up from the almost 15-year low of 3.8 months recorded in February, it remains almost a full month below the long-term average of 5.2 months. With the overall number of listings on the market continuing to fall in March, the m-o-m decline in the months of inventory measure was entirely the result of the outsized drop in sales activity.
National measures of market balance continue to mask significant regional variations. The number of months of inventory is well above long-term averages in the Prairie provinces and Newfoundland & Labrador. By contrast, the measure is running well below long-term averages in Ontario, Quebec and the Maritime provinces. The measure remains in balanced territory in British Columbia.
With measures of market balance at this point little changed from recent history, and most of the impact on sales and listings from the COVID-19 situation only showing up towards the end of March, the impact on housing prices will likely take a little longer to become apparent. Price measures for March 2020 were strongly influenced by very tight markets and a very strong start to the spring market in many parts of Canada before physical distancing measures were implemented.
The Aggregate Composite MLS® Home Price Index (MLS® HPI) rose 0.8% in March 2020 compared to February, marking its 10th consecutive monthly gain.
The MLS® HPI was up in March 2020 compared to the previous month in 16 of the 19 markets tracked by the index.
Looking at the major Prairie markets, home price trends have ticked downwards in Calgary and Edmonton to start 2020 but have generally been stable since the beginning of last year. Prices in Saskatoon have also been stable over the last year, while those in Regina have continued to trend lower. Prices in Winnipeg have been on a slow upward trend since the beginning of 2019.
Meanwhile, the recovery in home prices has been in full swing throughout British Columbia and in Ontario’s Greater Golden Horseshoe (GGH) region. Further east, price growth in Ottawa, Montreal and Moncton continues as it has for some time now, with Ottawa and Montreal prices accelerating to start 2020.
Comparing home prices to year-ago levels yields considerable variations across the country, although for the most part trends are still regionally split along east/west lines, with gains ranging near the low double-digits from Ontario east, more modest gains in B.C., and a mixed bag of even smaller gains and some declines across the Prairies.
The actual (not seasonally adjusted) Aggregate Composite MLS® HPI rose 6.9% y-o-y in March, the biggest year-over-year gain since January 2018.
Prices are in positive y-o-y territory in Greater Vancouver (+2.1%) and the Fraser Valley (+2%). Elsewhere in British Columbia, home prices logged y-o-y increases about twice as large in the Okanagan Valley (+5.1%), Victoria (+5%) and elsewhere on Vancouver Island (+4.3%).
Calgary and Edmonton continued to post small y-o-y price declines (-0.8% and -1.3%, respectively), while the y-o-y gap was -5.1% in Regina. Prices in Saskatoon (+0.4%) and Winnipeg (+1.2%) both posted small y-o-y increases in March.
In Ontario, home price growth has re-accelerated across the GGH, with a number of markets posting double-digit y-o-y growth in the 11% range. Meanwhile, price gains in recent years have continued uninterrupted in Ottawa (+15.8%), Montreal (+11.3%) and Moncton (+8.1%).
All benchmark home categories tracked by the index accelerated further into positive territory on a y-o-y basis. Apartment units posted the biggest y-o-y increase (+7.4%) followed closely by prices for two-storey single family homes (+7.3%). One-storey single-family home prices were up 6.2% y-o-y in March, while prices for townhouse/row units climbed 5.6%.
The MLS® HPI provides the best way to gauge price trends because averages are strongly distorted by changes in the mix of sales activity from one month to the next.
The actual (not seasonally adjusted) national average price for homes sold in March 2020 was just over $540,000, up 12.5% from the same month the previous year.
The national average price is heavily influenced by sales in the GVA and GTA, two of Canada’s most active and expensive housing markets. Excluding these two markets from calculations cuts more than $130,000 from the national average price, trimming it to around $410,000.
PLEASE NOTE: The information contained in this news release combines both major market and national sales information from MLS® Systems from the previous month.
CREA cautions that average price information can be useful in establishing trends over time, but does not indicate actual prices in centres comprised of widely divergent neighbourhoods or account for price differential between geographic areas. Statistical information contained in this report includes all housing types.
MLS® Systems are co-operative marketing systems used only by Canada’s real estate Boards to ensure maximum exposure of properties listed for sale.
The Canadian Real Estate Association (CREA) is one of Canada’s largest single-industry associations, representing more than 130,000 REALTORS® working through 90 real estate boards and associations.